
Election Day 2016 Coverage - 11 New Communities Vote to Adopt CPA
 Nov. 9th, 2016: It was an historic night for CPA, as 11 new communities voted to adopt the Act. This marks the highest amount of CPA adoptions in one election in the history of the program, eclipsing the 10 communities who adopted in November 2004. What is especially remarkable is that both the capital city of Boston and large gateway cities across the state are on the list of adoptees this year. The success on election night brings the total number of CPA communities to 172, or 49% of the cities and towns in the state.
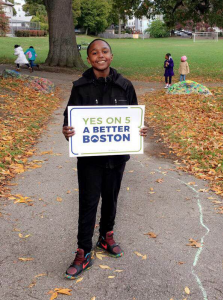
Six out of the eight cities with CPA on the ballot voted in favor of adoption: Boston, Chelsea, Holyoke, Pittsfield, Springfield, and Watertown. In a stunning show of support across the state, many of these communities passed CPA by large margins. Chelsea, Pittsfield, Springfield, and Watertown each had nearly a 2:1 ratio of voters in favor of adoption. Boston was a standout success as well, thanks in part to their robust campaigning—the city voted in favor of adoption by 74%. The two remaining cities that voted against adoption were Amesbury and Palmer.
 Over half of the towns that had CPA on the ballot saw successes as well, though several communities had very close races. Out of the eight towns with CPA on the ballot, Billerica, Hull, Norwood, Rockland, and Wrentham each voted in favor of adoption. Three towns were unsuccessful in their attempts: Danvers, East Bridgewater, and South Hadley.
We’ve created the chart below, breaking down how each community voted on CPA in further detail. And be sure to take a look at the newly updated CPA Adoption Map—with just under half of all cities and towns across the Commonwealth having now adopted, we expect the enthusiasm and support for CPA statewide to continue!
Further Resources:
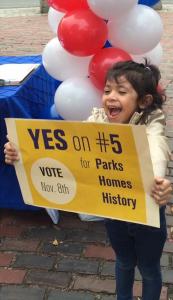
- Photos of the Campaigns From Our New CPA Communities
- State House News - "Voters in Record 11 Communities Agree to CPA Taxes"
- Boston Business Journal - "Boston Votes to Adopt Community Preservation Act"
- MassLive - "Springfield Voters Approve CPA Tax Surcharge"
- Wicked Local Billerica - "CPA Passes in Billerica by Slim Margin"
CPA Adoption Results from November 8th, 2016:
City/Town | Result | Vote Tally | Surcharge | Exemptions |
|---|---|---|---|---|
Amesbury | Fail | Yes: 3,667 (41%) No: 5,286 (59%) | 1% | low/moderate income, first $100,000 residential, first $100,000 commercial |
Billerica | Pass | Yes: 10,743 (52%) No: 9,953 (48%) | 1% | low/moderate income, first $100,000 residential, first $100,000 commercial |
| Boston | Pass | Yes: 177,174 (74%) No: 63,410 (26%) | 1% | low/moderate income, first $100,000 residential, first $100,000 commercial |
Chelsea | Pass | Yes: 5,460 (66%) No: 2,752 (34%) | 1.5% | low/moderate income, first $100,000 residential, first $100,000 commercial |
| Danvers | Fail | Yes: 5,898 (40%) No: 8,987 (60%) | 1.5% | low/moderate income, first $100,000 residential, first $100,000 commercial |
East Bridgewater | Fail | Yes: 3,052 (40%) No: 4,513 (60%) | 1.5% | low/moderate income, first $100,000 residential |
Holyoke | Pass | Yes: 8,641 (56%) No: 6,900 (41%) | 1.5% | low/moderate income, first $100,000 residential, first $100,000 commercial |
| Hull | Pass | Yes: 3657 (59%) No: 2517 (41%) | 1.5% | low/moderate income |
| Norwood | Pass | Yes: 8,835 (61%) No: 5,660 (39%) | 1% | low/moderate income, first $100,000 residential, first $100,000 commercial |
Palmer | Fail | Yes: 2,736 (48%) No: 3,011 (52%) | 1.5% | first $100,000 residential |
| Pittsfield | Pass | Yes: 11,850 (63%) No: 7,016 (37%) | 1% | low/moderate income, first $100,000 residential, first $100,000 commercial |
Rockland | Pass | Yes: 4,565 (50.5%) No: 4,480 (49.5%) | 1.5% | low/moderate income, first $100,000 residential, first $100,000 commercial |
South Hadley | Fail | Yes: 4,259 (48%) No: 4,699 (52%) | 1.5% | low/moderate income, first $100,000 residential, first $100,000 commercial |
Springfield | Pass | Yes: 27,873 (62%) No: 16,931 (38%) | 1.5% | low/moderate income, first $100,000 residential, first $100,000 commercial |
| Watertown | Pass | Yes: 10,825 (61%) No: 6,896 (39%) | 2% | low/moderate income |
| Wrentham | Pass | Yes: 4,416 (68%) No: 2,045 (32%) | 1% | first $100,000 residential |